Ocean Tracks Interface
The Ocean Tracks interface has been designed based on guidelines developed in the NSF-funded Oceans of Data project to simplify the processes of accessing and analyzing data so that students can focus on making meaning of the data to investigate complex scientific questions. Using Ocean Tracks, students can select and display data collected by migrating marine animals, Earth-orbiting satellites, and drifting buoys. Ocean Tracks also provides a suite of student-friendly tools that can be used to analyze and describe the movements and behavior of migrating animals. The interface supports students in relating this behavior to aspects of the physical ocean environment, including sea surface temperature and surface chlorophyll, and in assessing the relationship of humans to the oceans via data layers displaying human impacts from NCEAS and Marine Protected Areas*. Ocean Tracks provides support to students in linking multiple different datasets through design features that simplify the process of coordinating datasets that vary over space and time. Students can also take measurements of oceanographic data overlays, and quantify patterns in habitat usage by marine animals.
Easy Access to Data
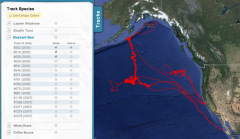
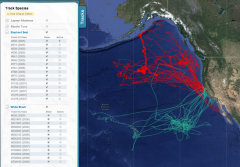
The Ocean Tracks interface supports students in displaying animal tracks from four different species in the Pacific Ocean: Pacific bluefin tuna, great white shark, Laysan albatross, and the northern elephant seal, as well as drifting buoys. Accessing these tracks is achieved using a simple drop-down menu, where students check a box to display a track.
[Click on images to enlarge.]
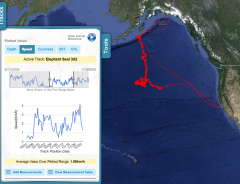
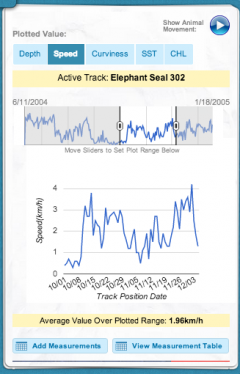
Each point along the animal’s track is associated with values for the daily traveling speed and maximum daily dive depth of that animal, and the average temperature and chlorophyll concentration at the ocean’s surface that day. The Ocean Tracks interface enables students to plot these variables for a selected portion of the track, and compute averages over a selected time period. Students select a portion of the track by manipulating a time slider, which highlights the points along the track that correspond to the selected time interval.
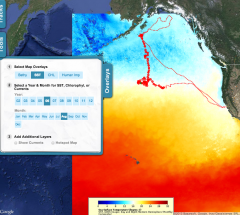
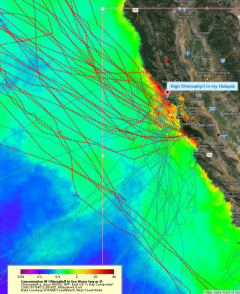
Ocean Tracks also makes available oceanographic data, including sea surface temperature and surface chlorophyll concentration in the form of map overlays. These map overlays represent monthly conditions, and can be selected by choosing a year and month to display in the overlay menu, or by clicking on a track point and selecting to display a sea surface temperature or chlorophyll overlay that corresponds to the month represented by that track point.
Students can also display maps showing the intensity of various human impacts throughout the world’s oceans, including shipping, pollution, and fishing, as well as indicators of climate change, including SST anomaly, UV anomaly, and ocean acidification. Students can also display a map of cumulative human impacts, which integrates information across individual impacts. Also available are maps of Marine Protected Areas (MPA) for the Pacific Ocean.
Linking Multiple Data Sources
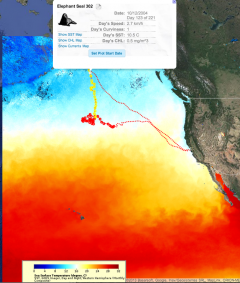
Beyond simply making these data available to students, the Ocean Tracks interface provides support to students in selecting the appropriate data to display. This is a complex task because the animals are moving through the ocean environment, which is changing from location to location and from minute to minute. Therefore, it is imperative that students can conceptualize how data correspond across space and time. One example of how the Ocean Tracks interface supports students in doing so is by enabling access to data overlays through clicking on a track point. The students then have the option to display the corresponding sea surface temperature, chlorophyll concentration, or ocean currents map for that day. Because the oceanographic overlays represent monthly average conditions, all the track points in the month represented by the overlay are highlighted in yellow.
Ocean Tracks also provides students with a tool to measure the degree of curviness of an animal track, which is used as an indication of the animal’s behavior. A low track curviness value indicates directed movement from point A to point B, while high track curviness can indicate lingering or searching behavior, such as would be displayed if the animal is hunting, feeding, or breeding.
Identifying Patterns in Habitat Usage by Marine Animals
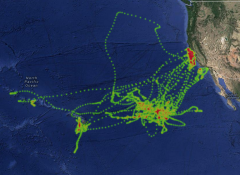
The Ocean Tracks interface also provides a tool that students can use to identify areas that are heavily used by marine species, or “biological hotspots.” This tool colors areas on the map according to the density of track points, with areas colored red corresponding to areas of high track density. Students may select to identify areas of the ocean that are important to a particular species, or areas that are used by multiple different species. They can then inspect the animal tracks and oceanographic data overlays to investigate hypotheses about what animals are doing in these areas, and the underlying reasons why they are biologically significant.
Using Ocean Tracks Tools to Perform Scientific Investigations: An Example
Students are prompted to carry out scientific investigations in “learning modules" (high school modules | college modules). In one of these modules, students are asked to identify a biological hotspot in the Pacific Ocean, and explore the data to draw some inferences about the oceanographic conditions that create the biological hotspot.
Students first select animal tracks from a database of 65 bluefin tuna, white shark, elephant seal, and albatross tracks.
Students can then use the hotspot tool to highlight areas with high track density.
Students use additional data and tools on the website, such as maps of sea surface temperature and chlorophyll concentration, which they can overlay on their hot spot maps, to further explore the potential reasons animals frequent certain areas.
*Marine Protected Areas provided by ProtectedSeas.net in partnership with the NOAA MPA Center.

